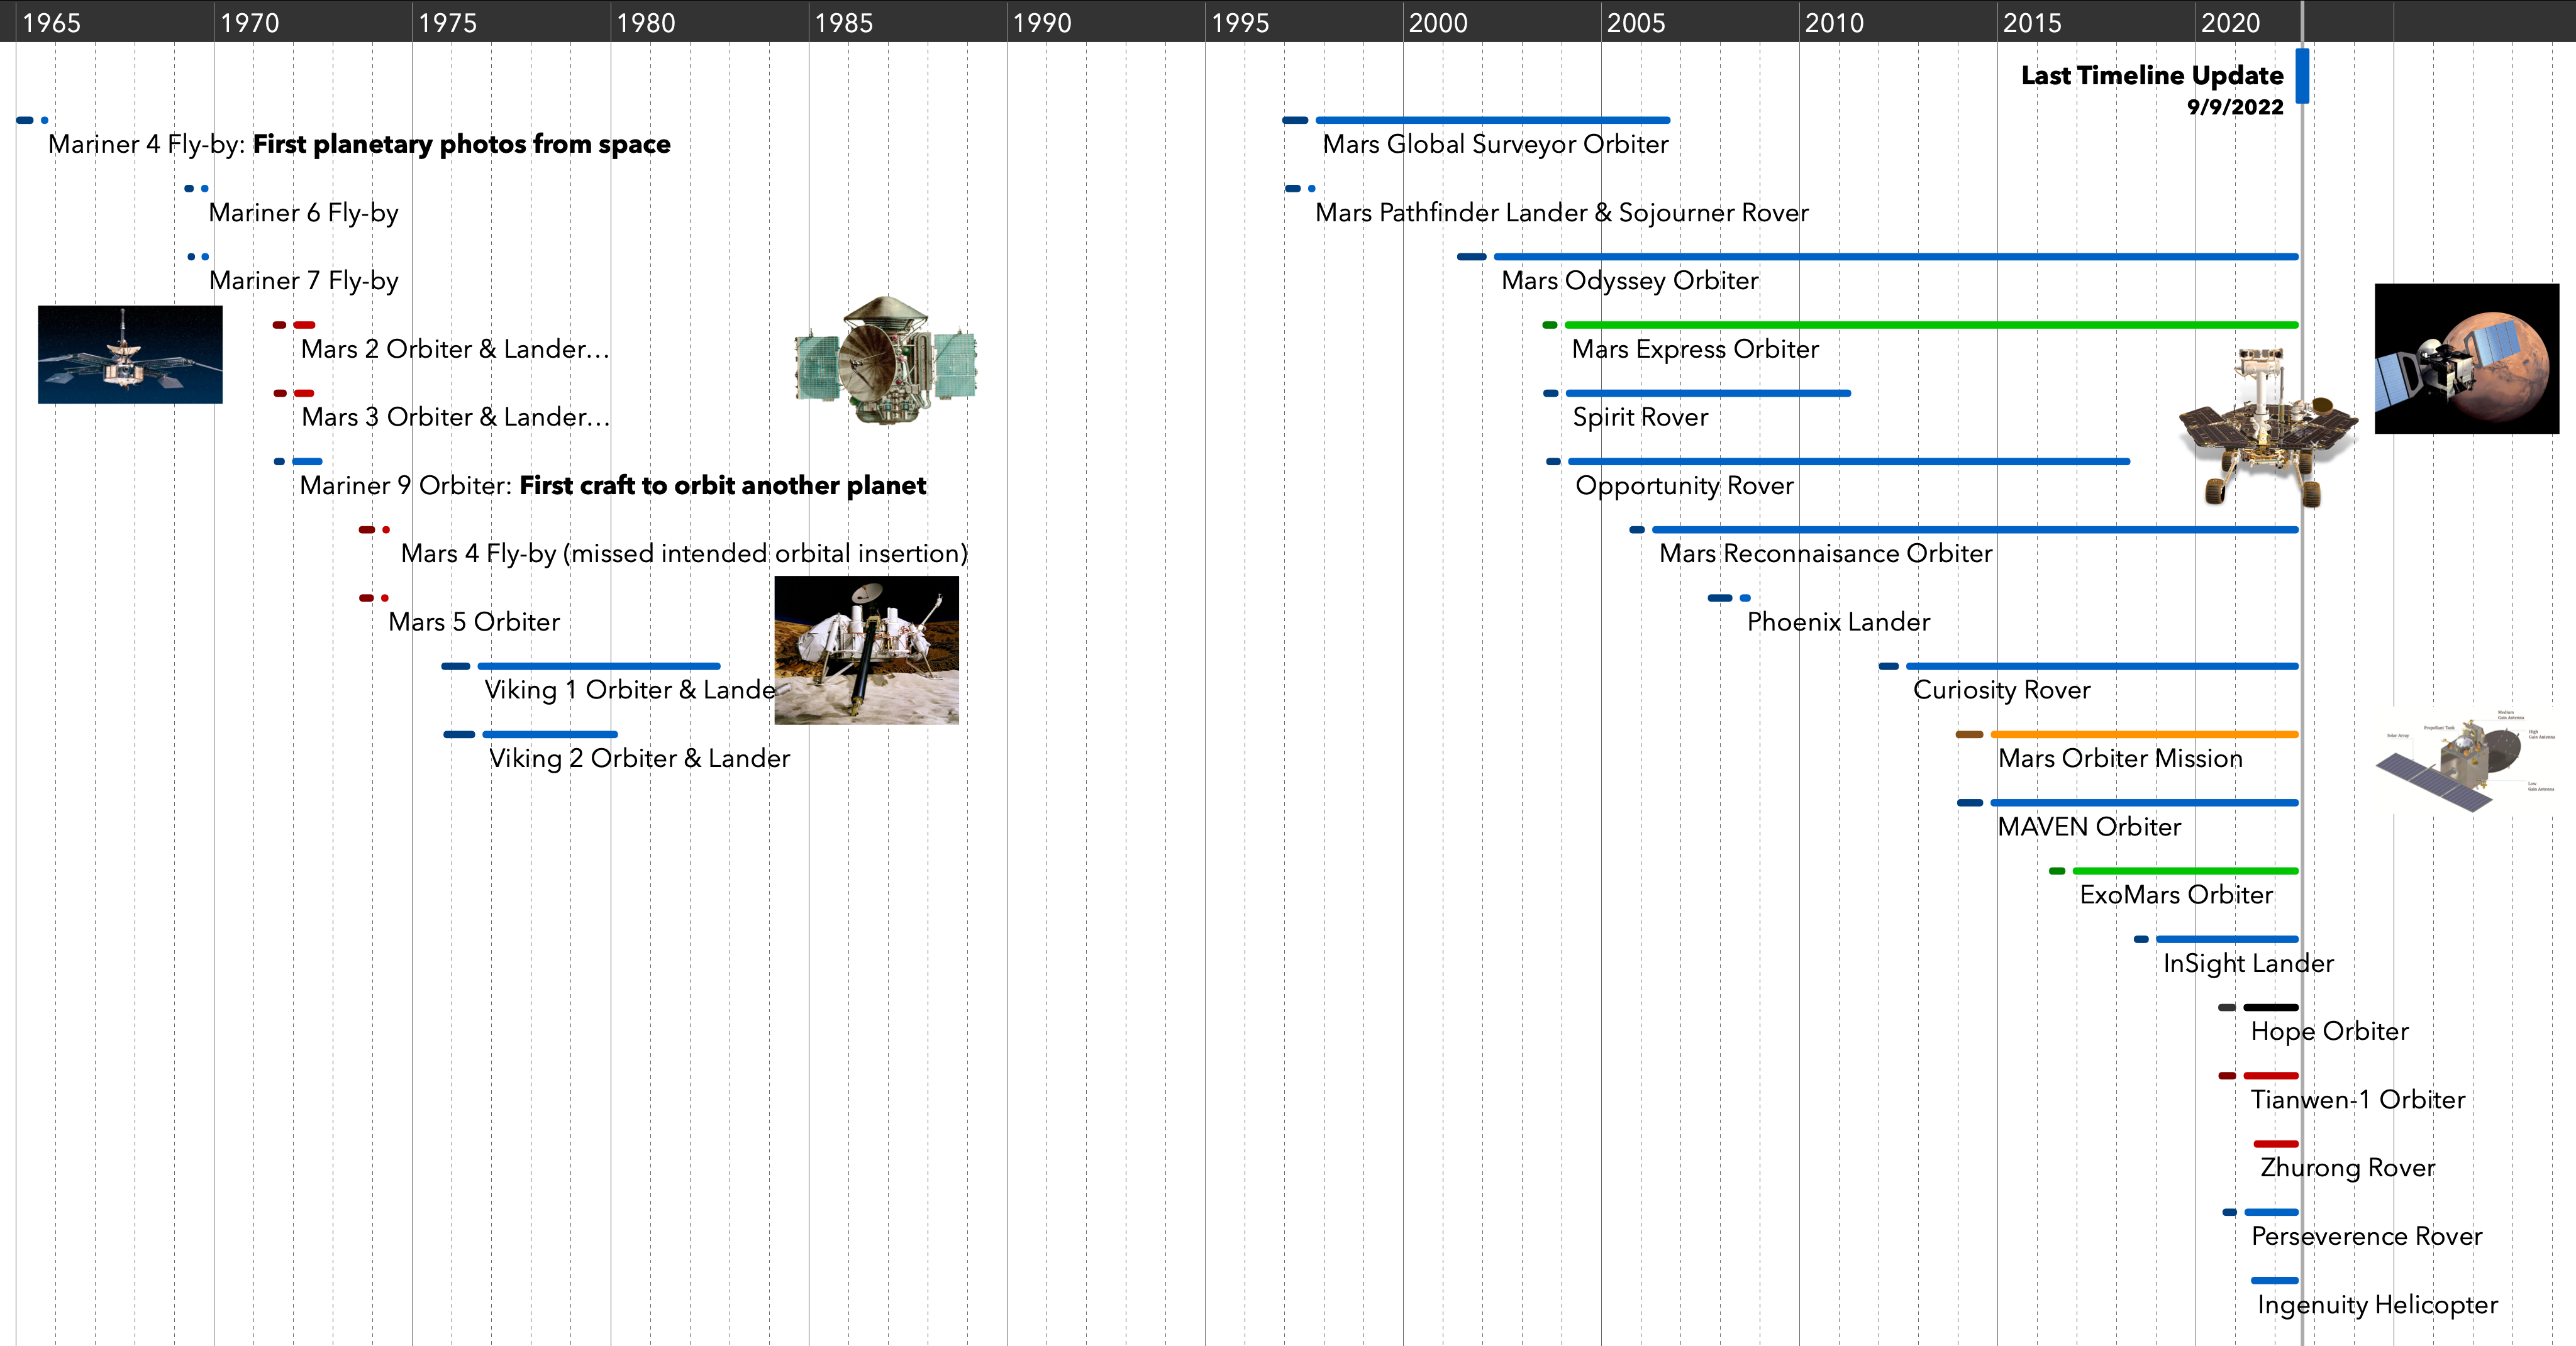
I’m in the process of wrapping up TimeStory 3.0 for release. One of the fun little things that I get to do with each major release is update the included Exploration of Mars example timeline. For V3, I’m playing around with the new thin-bar style and vertical grid options, while checking and updating dates.
InSight is reaching the end of its mission, its dust-covered solar panels producing less and less power, but it’s still running and able to collect seismographic data. Ingenuity recently had another demonstration flight, kicking off some accumulated dust. Our little fleet of orbiters, stations, and rovers are still up there working, collecting data and sending it back to homes all over Earth.
Sometimes, here at home, it gets difficult to remember, but we humans are capable of working together and achieving some astonishing things.